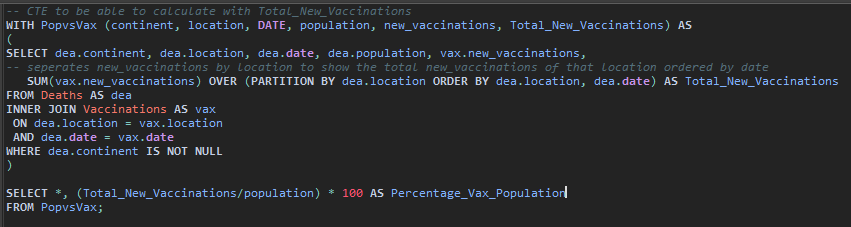
What percent of people are newly vaccinated in a given location?
This query explores the relationship between the total population from the “Deaths” table and new vaccinations from the “Vaccinations” table.
In this query, the Deaths and Vaccination tables were INNER JOINED to be able to create the new column Total_New_Vaccinations.
Total_New_Vaccinations is the total vaccinations per location in order of ascending date to show the gradual change. Finally, using a common table expression, Total_New_Vaccinations can be temporarily used to calculate the percentage of the population that is vaccinated on a specific date.
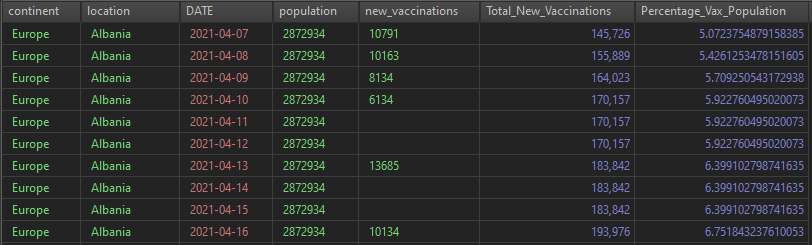
What is the likelihood of dying from COVID19 in a specific country?
This query selects the appropriate columns and uses that selection to calculate the percentage of deaths.
From this query, you can infer that with all other variables constant, the average person has an estimated 2.4% chance of dying from Covid19 in the specified country.
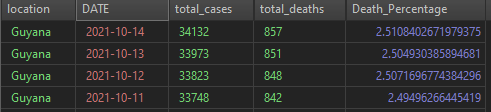
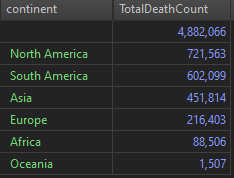
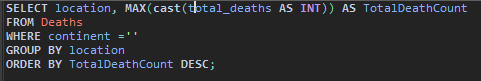
Which continent has the highest death count?
In this query, the column total_deaths is a nvarchar data type and must be casted to an INT data type to play nice with the aggregate function MAX().
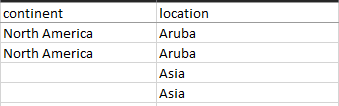
When executed, the above query gives a FALSE output because of the structure of the data in the CSV file.
In the location column, all countries have their corresponding continents. However, in the location column are also data points for whole continents with empty fields for continent.
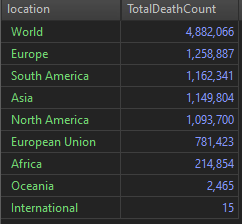
Therefore, we select the location column and filter the selection by locations where the continent column is empty. The query now selects the accurate continent data from the location column.
Which country has the highest percentage of infection?
This query shows the percentile of infections based on the total population.